Home » Trailer Industry » Trailer Industry News » USA Truck Financial Results 2021
USA Truck Reports Record Fourth Quarter and Full Year 2021 Results
- Earnings per diluted share increased 104.5% to $1.35 for 4Q 2021 and 420.8% to $2.76 for full year 2021
- Adjusted earnings per diluted share(a) increased 100.0% to $1.38 for 4Q 2021 and 346.9% to $2.86 for full year 2021
- Consolidated operating revenue increased 26.4% to $200.9 million for 4Q 2021 and 28.9% to $710.4 million for full year 2021
Van Buren, AR – (Trailer Technician) – USA Truck Inc. (NASDAQ: USAK), a leading capacity solutions provider, today announced its financial results for the quarter and year ended December 31, 2021.
For the quarter ended December 31, 2021 (the “2021 Quarter”), consolidated operating revenue was $200.9 million compared to $158.8 million for the quarter ended December 31, 2020 (the “2020 Quarter”). Base revenue(a) for the 2021 Quarter, which excludes fuel surcharge revenue, was $180.7 million compared to $148.2 million for the 2020 Quarter. The Company reported net income of $12.2 million, or $1.35 per diluted share for the 2021 Quarter and adjusted net income(a) of $12.4 million, or $1.38 per diluted share, compared to net income of $5.9 million, or $0.66 per diluted share and adjusted net income(a) of $6.2 million, or $0.69 per diluted share for the 2020 Quarter. Our 4Q 2021 earnings per diluted share was positively affected by an IRS deductibility clarification that resulted in a $0.06 increase in earnings per diluted share. The Company’s consolidated operating ratio was 91.8%, compared to 93.9% for the 2020 Quarter.
President and CEO James Reed commented, “The company transformation that we have discussed over the last several years has yielded our sixth straight quarter of record adjusted earnings per share(a). The fourth quarter and full year 2021 represent our highest total revenue and adjusted earnings per share(a) in the Company’s history.
During the fourth quarter, continued execution on our strategic initiatives, operational strategy and a strong freight and pricing market resulted in a Trucking segment adjusted operating ratio(a) improvement of 440 basis points year over year to 88.7%. Our USAT Logistics segment provided a 23.4% increase in load volume with operating revenue up 44.9% year over year.”
Trucking: For the 2021 Quarter, Trucking operating revenue (before intersegment eliminations) increased $15.2 million, or 14.6%, to $119.5 million compared to the 2020 Quarter. Trucking operating income of $11.6 million for the 2021 Quarter reflected an operating ratio of 90.3% compared to operating income of $6.4 million and an operating ratio of 93.9% for the 2020 Quarter. This represented an increase of $5.2 million year over year in operating income and a 360 basis point improvement in operating ratio.
Trucking adjusted operating income(a) was $11.9 million for the 2021 Quarter, reflecting an adjusted operating ratio(a) of 88.7%, compared to adjusted operating income(a) of $6.7 million and an adjusted operating ratio(a) of 93.1% for the 2020 Quarter. This represented an increase of $5.2 million year over year in adjusted operating income(a) and a 440 basis point improvement in adjusted operating ratio(a).
Trucking operations delivered the following results for the 2021 Quarter compared to the 2020 Quarter:
- Base revenue per available tractor per week increased $443, or 11.5%.
- Base revenue per loaded mile increased $0.502, or 19.8%.
- Deadhead percentage increased 10 basis points over both the 2020 Quarter and sequential quarter.
- Loaded miles per available tractor per week decreased 106 miles, or 7.0%.
- Average number of seated tractors was 1,761, a decrease of 0.8% when compared to an average of 1,776 in the 2020 Quarter. Average unseated tractor percentage was 6.1%, an improvement from 6.9% for the 2020 Quarter, but increased from 5.8% sequentially.
USAT Logistics: Operating revenue (before intersegment eliminations) was $94.6 million for the 2021 Quarter, an increase of $29.3 million, or 44.9% compared to the 2020 Quarter. Both operating income and adjusted operating income(a) were $4.9 million for the 2021 Quarter, reflecting an operating ratio of 94.8% and an adjusted operating ratio(a) of 94.4%, compared to operating income and adjusted operating income(a) of $3.4 million and an operating ratio of 94.8% and adjusted operating ratio(a) of 94.6% for the 2020 Quarter. This change represented an increase of $1.5 million year over year in both operating income and adjusted operating income(a). The operating ratio was unchanged while the adjusted operating ratio(a) improved 20 basis points compared to the 2020 Quarter.
- USAT Logistics operations delivered the following results during the 2021 Quarter:
- Gross margin dollars increased 26.9% to $11.9 million compared to the 2020 Quarter, and 24.9%, or $2.4 million, sequentially.
- Gross margin percentage decreased 180 basis points to 12.5% when compared to 14.3% for the 2020 Quarter and increased 90 basis points sequentially from 11.6%.
- Revenue per load increased 17.4%, or $349 per load compared to the 2020 Quarter, and 5.9%, or $132 per load, sequentially.
- Load count increased by 7,640 loads, or 23.4% compared to the 2020 Quarter, and 3,497 loads, or 9.5%, sequentially.
Segment Results
The following table includes key operating results and statistics by reportable segment:
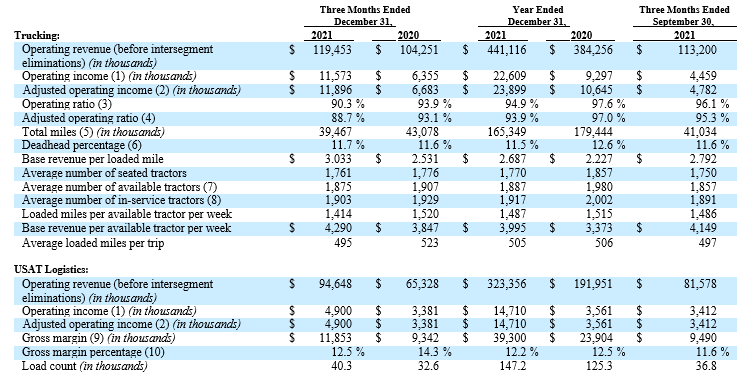
1) Operating income is calculated by deducting operating expenses (before intersegment eliminations) from operating revenue (before intersegment eliminations).
2) Adjusted operating income(a) is calculated by deducting operating expenses (before intersegment eliminations) excluding amortization of acquisition related intangibles, net of fuel surcharge revenue, from operating revenue (before intersegment eliminations), net of fuel surcharge revenue.
3) Operating ratio is calculated as operating expenses (before intersegment eliminations) as a percentage of operating revenue (before intersegment eliminations).
4) Adjusted operating ratio(a) is calculated as operating expenses (before intersegment eliminations) excluding amortization of acquisition related intangibles, net of fuel surcharge revenue, as a percentage of operating revenue (before intersegment eliminations) excluding fuel surcharge revenue.
5) Total miles include both loaded and empty miles.
6) Deadhead percentage is calculated by dividing empty miles by total miles.
7) Available tractors are a) all Company tractors that are available to be dispatched, including available unseated tractors, and b) all tractors in the independent contractor fleet.
8) In-service tractors include all of the tractors in the Company fleet (Company-operated tractors) and all the tractors in the independent contractor fleet.
9) Gross margin is calculated by deducting USAT Logistics purchased transportation expense from USAT Logistics operating revenue (before intersegment eliminations).
10) Gross margin percentage is calculated as USAT Logistics gross margin divided by USAT Logistics operating revenue (before intersegment eliminations).
Balance Sheet and Liquidity
As of December 31, 2021, total debt and finance lease liabilities was $144.8 million, total debt and finance lease liabilities, net of cash (excluding restricted cash) (“Net Debt”)(a) was $143.8 million. Net Debt(a) to Adjusted EBITDA(a) for the trailing twelve months ended December 31, 2021 was 1.9x, and the Company had $124.1 million available to borrow under its credit facility as of December 31, 2021.
Also, on January 31, 2022 the Company completed a $130.0 million asset backed credit facility that provides more predictable equipment valuation and increased borrowing capacity, as well as equipment financing arrangements that secure low cost fixed interest rates.
Fourth Quarter 2021 Conference Call Information
USA Truck will hold a conference call to discuss its fourth quarter 2021 results on Friday, February 4, 2022 at 8:00 AM CT / 9:00 AM ET. To participate in the call, please dial 1-888-506-0062 (Toll Free) or 1-973-528-0011 (International) and reference access code 114576. A live webcast of the conference call will be broadcast in the Investor Relations section of the Company’s website www.usa-truck.com, under the “Events & Presentations” tab of the “Investor Relations” menu. For those who cannot listen to the live broadcast, the presentation materials and an audio replay of the call will be available at our website, www.usa-truck.com, under the “Events & Presentations” tab of the ”Investor Relations” menu, or may be accessed using the following link: https://www.webcaster4.com/Webcast/Page/2611/44185. A telephone replay of the call will also be available for one year from the date of the call.
(a) About Non-GAAP Financial Information
In addition to our GAAP results, this press release also includes certain non-GAAP financial measures, as defined by the SEC. The terms “Base Revenue”, “Net Debt”, “Adjusted EBITDA”, “Adjusted operating ratio”, “Adjusted operating income”, “Adjusted net income”, and “Adjusted earnings per diluted share”, as we define them, are not presented in accordance with GAAP.
The Company defines Base Revenue as operating revenue less fuel surcharge revenue and intercompany eliminations. The Company defines Net Debt as total debt, including insurance premium financing and financing lease liabilities, net of cash. The Company defines Adjusted EBITDA as net income, plus interest expense net of interest income, provision for income tax expense, depreciation and amortization, and non-cash equity compensation. Adjusted operating ratio is calculated as operating expenses excluding amortization of acquisition related intangibles, net of fuel surcharge revenue, as a percentage of operating revenue excluding fuel surcharge revenue. Adjusted operating income is calculated by deducting operating expenses excluding amortization of acquisition related intangibles, net of fuel surcharge revenue, from operating revenue, net of fuel surcharge revenue. Adjusted net income is defined as net income excluding amortization of acquisition related intangibles plus or minus the income tax effect of such adjustments using a statutory tax rate. Adjusted earnings per diluted share is defined as Adjusted net income divided by the weighted average number of diluted shares outstanding during the period. The per-share impact of each item is determined by dividing it by the weighted average diluted shares outstanding. These financial measures supplement our GAAP results in evaluating certain aspects of our business. We believe that using these measures improves comparability in analyzing our performance because they remove the impact of items from our operating results that, in our opinion, do not reflect our core operating performance. Management and the board of directors focus on Base Revenue, Net Debt, Adjusted EBITDA,
Adjusted operating ratio, Adjusted operating income, Adjusted net income, and Adjusted earnings per diluted share as key measures of our performance and liquidity, each of which are reconciled to the most comparable GAAP financial measure and further discussed below. We believe our presentation of these non-GAAP financial measures is useful to investors and other users because it provides them the same information that we use internally for purposes of assessing our core operating performance.
These non-GAAP financial measures are not substitutes for their comparable GAAP financial measures, such as total revenue, total debt, net income, cash flows from operating activities, operating ratio, net income, diluted earnings per share, or other measures prescribed by GAAP. There are limitations to using non-GAAP financial measures. Although we believe that they improve comparability in analyzing our period to period performance, they could limit comparability to other companies in our industry if those companies define or calculate these measures differently. Because of these limitations, our non-GAAP financial measures should not be considered measures of income generated by our business or discretionary cash available to us to invest in the growth of our business. Management compensates for these limitations by primarily relying on GAAP results and using non- GAAP financial measures on a supplemental basis.
Pursuant to the requirements of Regulation G and Regulation S-K, we have provided reconciliations of Base Revenue, Net Debt, Adjusted EBITDA, Adjusted operating ratio, Adjusted operating income, Adjusted net income, and Adjusted earnings per diluted share to the most comparable GAAP financial measures at the end of this press release.
Cautionary Statement Concerning Forward-Looking Statements
Financial information in this press release is preliminary and based upon information available to the Company as of the date of this press release. As such, this information remains subject to the completion of our quarterly review procedures, and the filing of the related Annual Report on Form 10-K, which could result in changes, some of which could be material, to the preliminary information provided in this press release.
This press release contains forward-looking statements within the meaning of Section 27A of the Securities Act of 1933, as amended and Section 21E of the Securities Exchange Act of 1934, as amended. Such forward-looking statements are made pursuant to the provisions of the Private Securities Litigation Reform Act of 1995. These statements generally may be identified by their use of terms or phrases such as “seeks,” “expects,” “estimates,” “anticipates,” “projects,” “believes,” “hopes,” “plans,” “goals,” “intends,” “may,” “might,” “likely,” “will,” “should,” “would,” “could,” “potential,” “predict,” “continue,” “strategy,” “future” and terms or phrases of similar substance. In this press release, statements relating to progress towards our strategic vision and goals, as well as our future mix of asset light and asset heavy revenues are forward-looking statements. Forward-looking statements are based upon the current beliefs and expectations of our management and are inherently subject to risks and uncertainties, including the impacts and duration of the COVID-19 pandemic. In addition, there are other risks, some of which cannot be predicted or quantified, which could cause future events and actual results to differ materially from those set forth in, contemplated by, or underlying the forward-looking statements. Accordingly, actual results may differ materially from those set forth in the forward-looking statements. Readers should review and consider the factors that may affect future results and other disclosures by the Company in its press releases, Annual Report on Form 10-K, Quarterly Reports on Form 10-Q, and other filings with the Securities and Exchange Commission. Any forward-looking statement speaks only as of the date on which it is made. We disclaim any obligation to update or revise any forward-looking statements to reflect actual results or changes in the factors affecting the forward-looking information, except as required by law. In light of these risks and uncertainties, the forward-looking events and circumstances discussed in this press release might not occur. All forward-looking statements attributable to us, or persons acting on our behalf, are expressly qualified in their entirety by this cautionary statement.
References to the “Company,” “we,” “us,” “our” and words of similar expression refer to USA Truck Inc. and its subsidiaries.
About USA Truck
USA Truck provides comprehensive capacity solutions to a broad and diverse customer base throughout North America. Our Trucking and USAT Logistics divisions blend an extensive portfolio of asset and asset-light services, offering a balanced approach for our customers’ supply chain management, including customized truckload, dedicated contract carriage, intermodal and third-party logistics freight management services. For more information, visit usa-truck.com or usatcapacitysolutions.com.
This press release and related information will be available to interested parties at our investor relations website, http://investor.usa-truck.com.