Home » Trailer Industry » Trailer Industry News » Truck Load Data Added to COVID-19 Impact Heatmap
FTR Adds Spot Load Volume To its Interactive COVID-19 Impact Heatmap
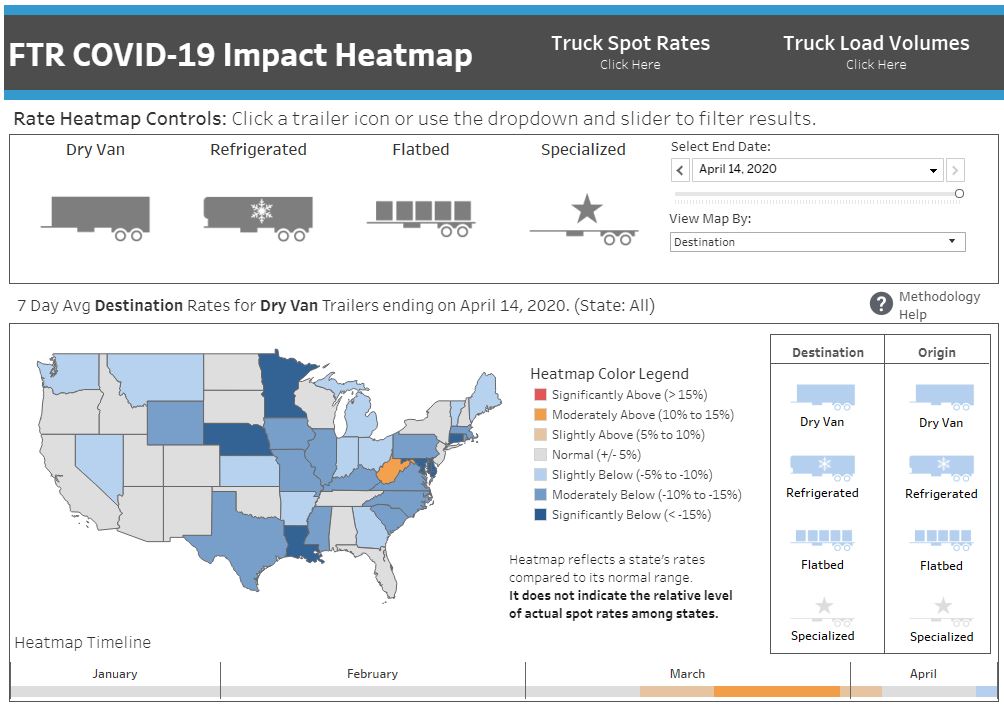
Bloomington, IN – (Trailer Technician) – Building on the resources that FTR has made available for transportation professionals, FTR’s COVID-19 Impact Heatmap now reflects truck load data in the spot market. Along with the previously released spot rate map, the heatmap provides state-level impacts on truck load volumes for four trucking equipment types – dry van, refrigerated, flatbed, and specialized – using Truckstop.com spot market data. Each combination of states and equipment type reflects rate and load trends for the states both as origins and destinations using the most recent seven days from the date selected.
This publicly available map can be viewed now at www.FTRintel.com/Coronavirus.
The new load volume feature in our COVID-19 Impact Heatmap spotlights how quickly market conditions have reversed, especially in dry van and refrigerated, which initially saw sharply higher volumes due to restocking and disruption. As the current heatmap shows, load volumes in all segments nationwide now are significantly below what we would have expected absent the COVID-19 crisis, and spot rates also are generally weaker, although not as uniformly so.
“The health and operational challenges facing truck drivers, carriers, shippers, and brokers have not gone away, but market conditions have changed sharply over the past several weeks,” said Avery Vise, FTR’s vice president of trucking. “Volume and rate weakness will continue during the current period of national containment, but the heatmap will help identify changing freight market conditions as we emerge from social distancing. The economic restart probably will not be uniform nationwide, so the heatmap will help freight transportation professionals assess when and where the freight market begins to recover.”
“We have long understood that our data helps freight professionals operate more intelligently, and never has the need been greater than it is today,” said Brent Hutto, chief relationship officer, Truckstop.com. “We are pleased to help bring tools like this to an industry that is so critical in keeping America going during an unprecedented crisis.”
What the Map Shows
FTR’s analysis examines historical seasonal behavior regarding rates and loads in each state and normalizes the data to represent how the trucking environment would look in the economy that existed prior to the COVID-19 crisis. By comparing that norm to the current rate and load environment, we can understand how COVID-19 is affecting rates on a state-by-state basis.
To build the heatmap, FTR started with average data points over the past five years and adjusted them based on how January 2020 – the most recent month during which COVID-19 had no significant impact on U.S. transportation – compared to the five-year average during that month. The result is what we would consider to be normal or expected absent the impact from COVID-19. FTR defines “normal” for each segment as a range than a specific number because inherent data variability. The heatmap’s color variations indicate the degree to which average rates and loads over the seven most recent days deviate – higher or lower – from the normal range during the same seven days. Users can view how that seven-day average changes each day to see how conditions have changed from early January through today.
Note that the heatmap does not indicate anything about the relative level of actual spot rates or loads among states. It reflects the status of a given state’s rates and loads compared to its own normal range.
About FTR
For more than 30 years, FTR has served as the industry leader in freight transportation forecasting for the shipping, trucking, rail, intermodal, equipment, and financial communities in North America. FTR’s experts, with over 230 years of combined experience in the transportation industry, provide quantitative analysis with historical and modal-specific insights. FTR’s reports, data, commentary, and insights help clients evaluate market risks, identify new opportunities, and make informed decisions.
FTR is the only company with a complete set of freight data for all modes of transportation with detail at the 3 Digit STCC commodity level. FTR tracks and forecasts 200+ unique commodity groups both quarterly and annually using their proprietary Freight•cast U.S. freight transportation model. FTR’s Transportation Conference held annually in September in Indianapolis is a unique event bringing together every aspect of the freight transportation world into one place. For more information www.FTRconference.com.
To learn more about FTR visit www.FTRintel.com, Follow us on twitter @FTRintel and connect with us on LinkedIn. To contact FTR, call 888-988-1699 or email info@ftrintel.com.